How to Best Match Your PVT Lab Data with a Black-Oil Model
Fitting an empirical black-oil correlation to an experimental dataset is essential for reservoir fluid modeling. You can now use your PVT Solver Premium Software to best match your PVT lab data with a black-oil model by following this step-by-step guide:
Note: Click any screenshot to enlarge it.
1
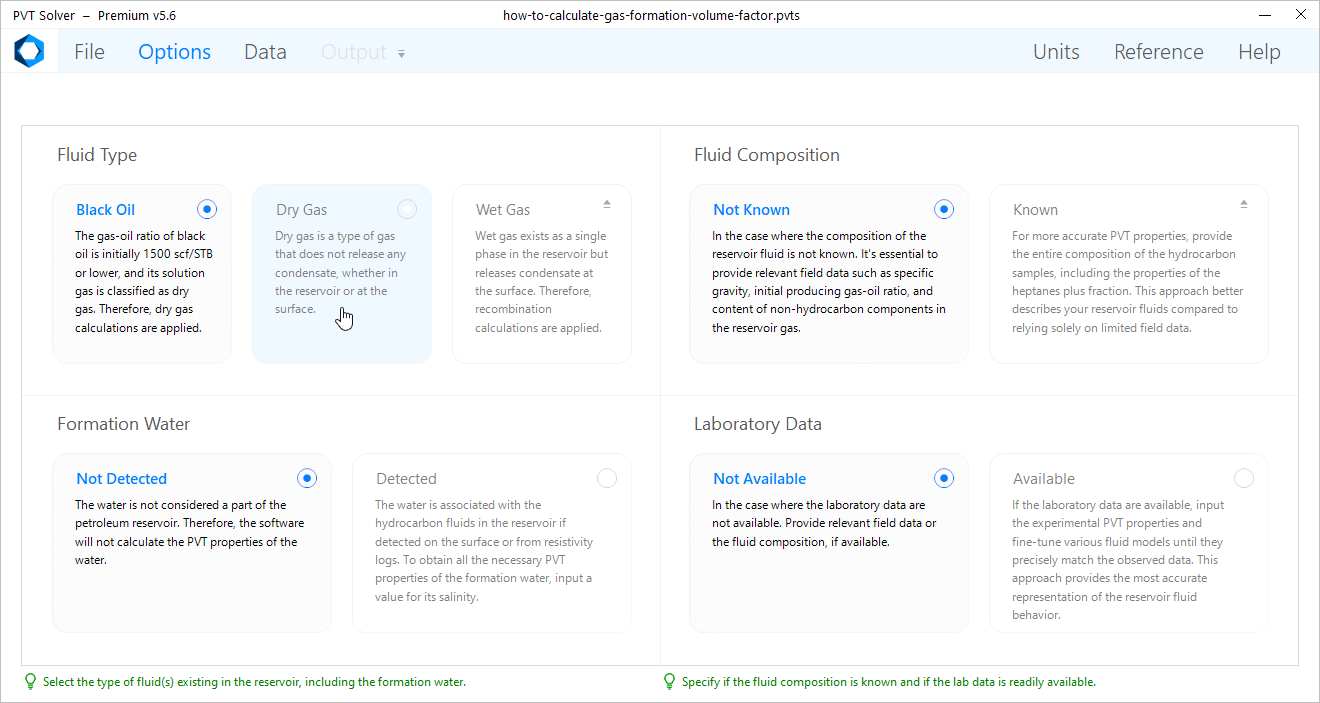
From the Navigation Bar, click on Options.
2
Under the Laboratory Data section, click on Available.
Note: Dry gas is the type of gas that theoretically doesn't release any liquid condensates, whether in the reservoir or at the surface.
3
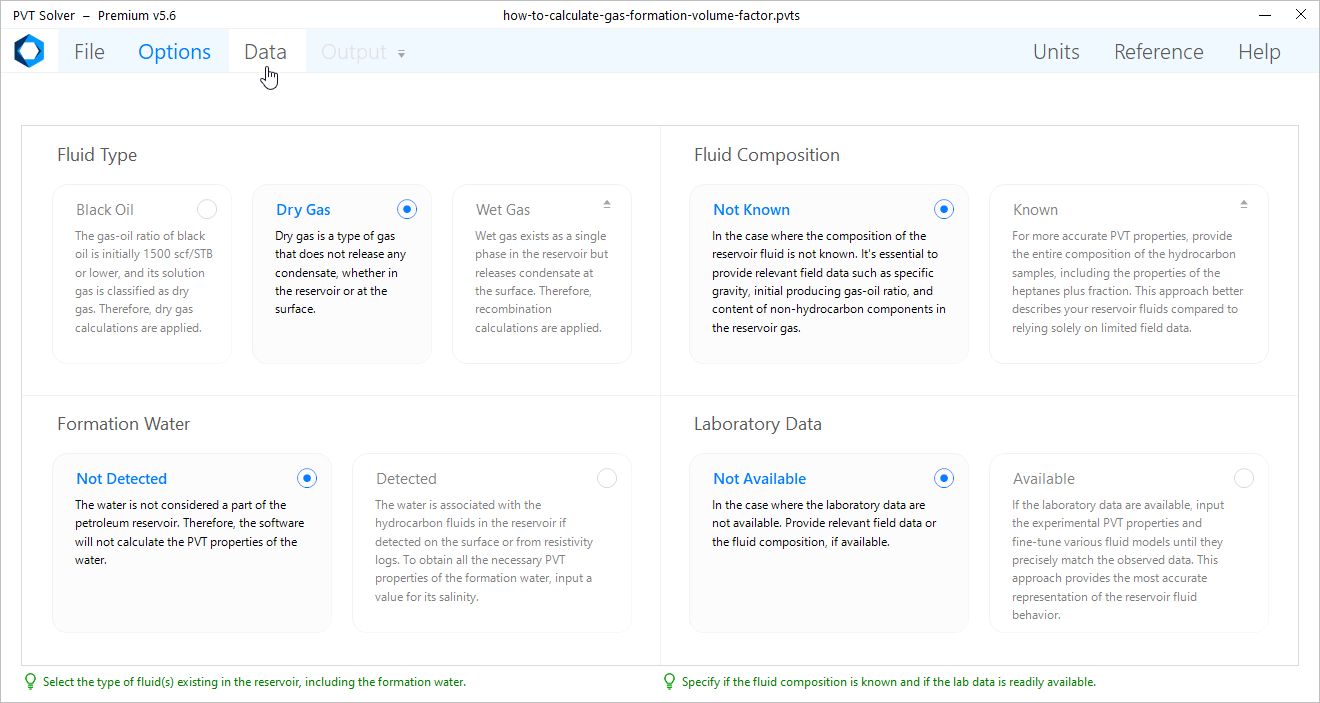
From the Navigation Bar, click on Data.
4
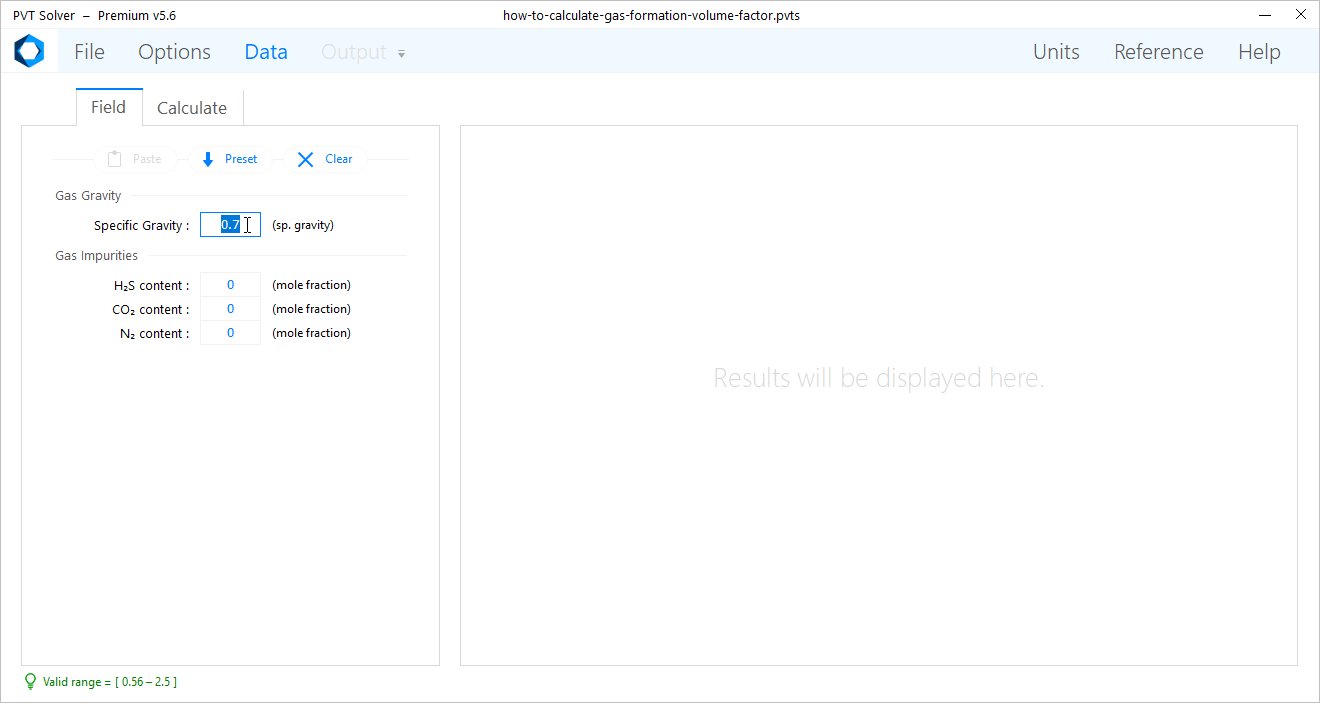
Under the Field tab, select the System of Separation whether Single Stage or Two Stage. And input the field parameters related to the selected system of separation.
Note: Click on “Units” in the Navigation Bar to select the appropriate system of units for the gas formation volume factor. The available options are as follows:
Single Stage:
Specific gravity of stock-tank oil
Two Stage: Properties of Separator Gas Available
First-stage separator gas specific gravity
Two Stage: Properties of Separator Gas Not Avialable
Solution gas-oil ratio at bubble point pressure
5
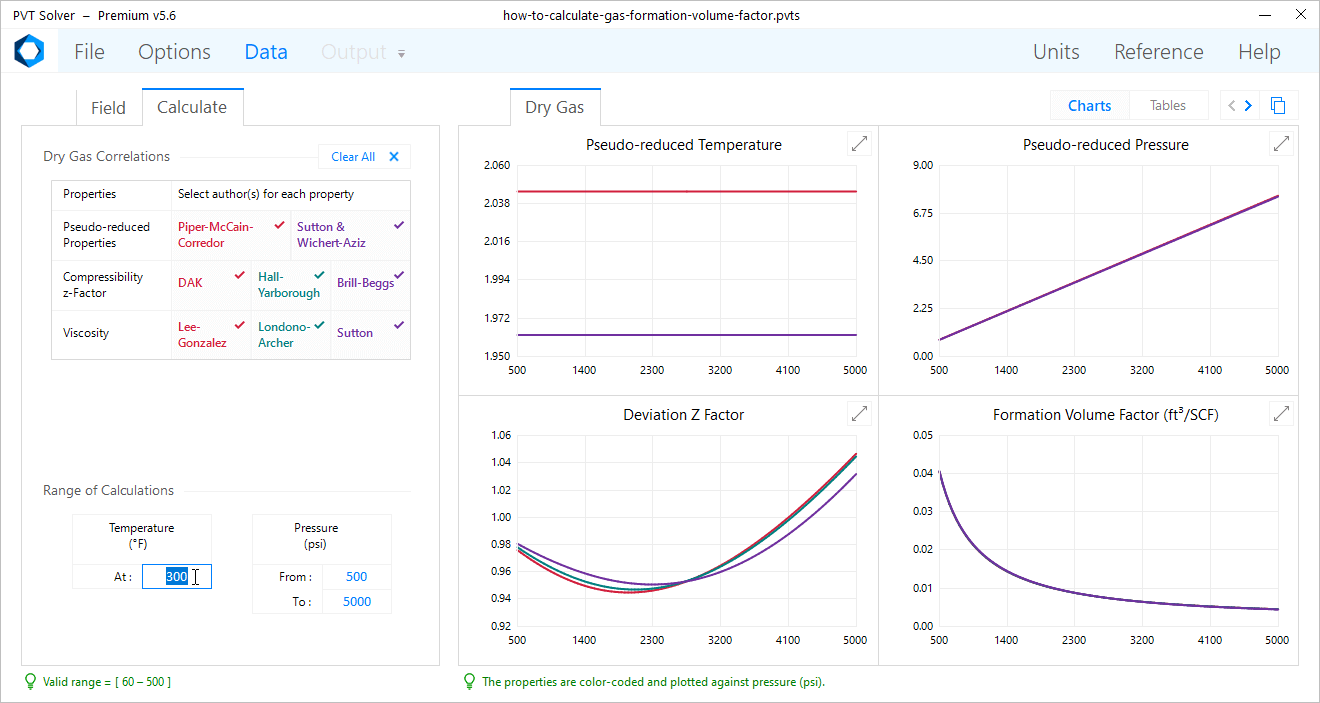
Click on the Calculate tab.
Note: Click on “Units” in the Navigation Bar to select the appropriate system of units for the gas formation volume factor. The available options are as follows:
Oil Gravity:
Specific gravity of stock-tank oil
Gas Gravity:
First-stage separator gas specific gravity
Producing GOR:
Solution gas-oil ratio at bubble point pressure
Note: Click on “Units” in the Navigation Bar to select the appropriate system of units for the gas formation volume factor. The available options are as follows:
Field unit:
Cubic feet of reservoir gas per one standard cubic foot (ft3/scf)
Metric unit:
Cubic meters of reservoir gas per one standard cubic meter (m3/sm3)
Custom unit:
Barrels of reservoir gas per one standard cubic foot (bbl/scf)
6
On the left-hand side, under the Range of Calculations section, input the reservoir Temperature and Pressure range at which the software will calculate all the gas PVT properties.
7
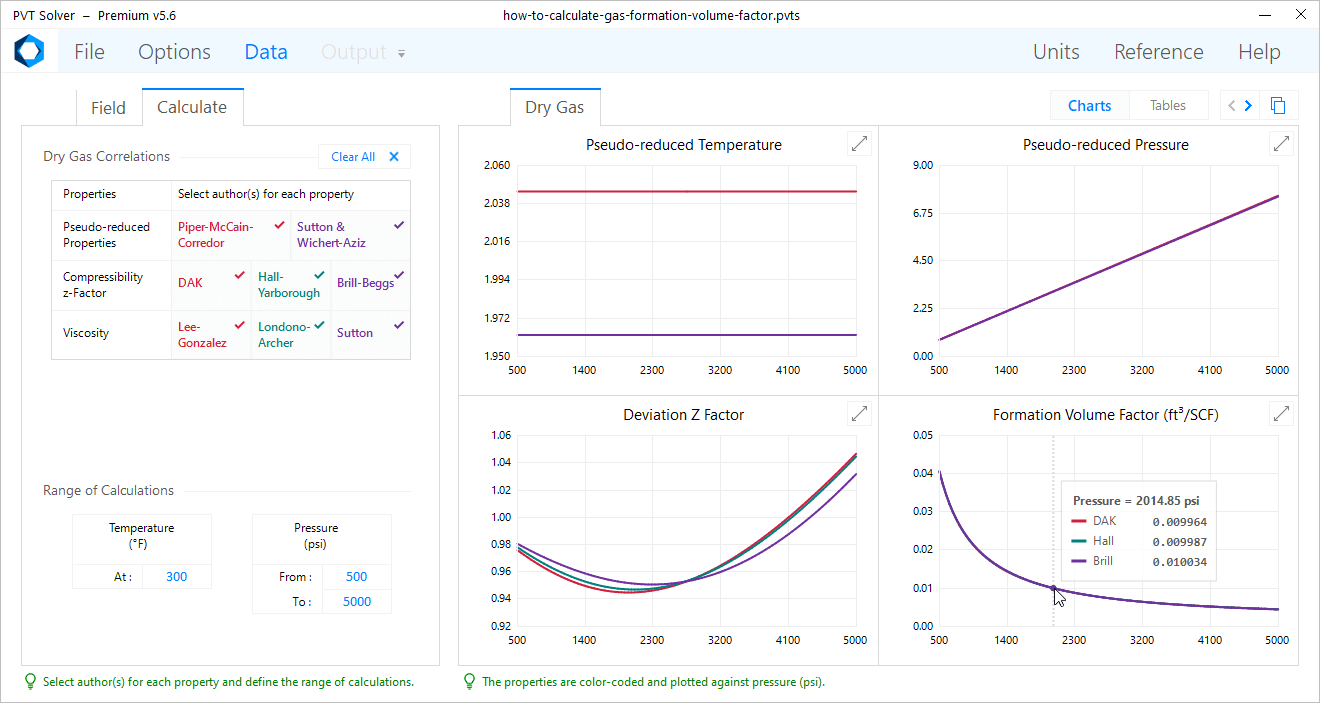
On the right-hand side, under the Dry Gas tab, you can view the Formation volume Factor chart and compare the plots of different fluid correlations.
Note: Hover over any chart to display different estimates of a fluid property at a specific reservoir pressure, obtained using various PVT correlations.
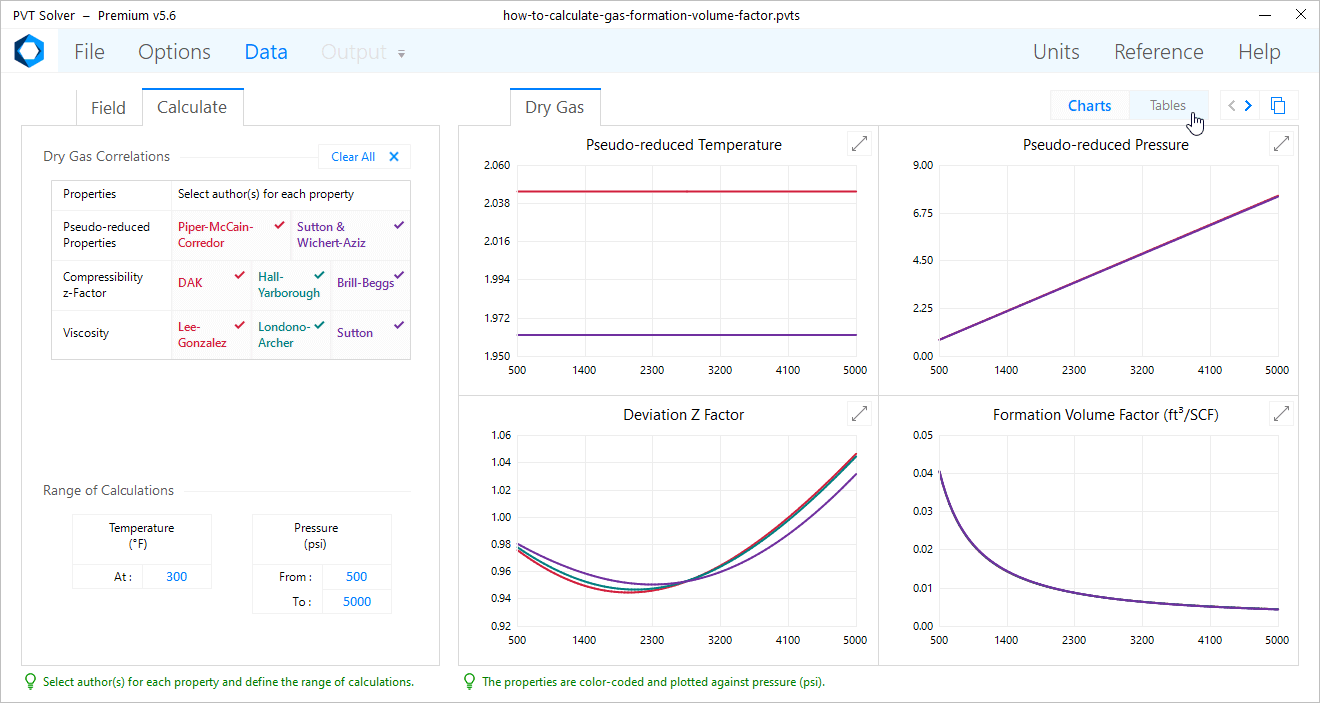
8
On the right-hand side, click on the Tables tab.
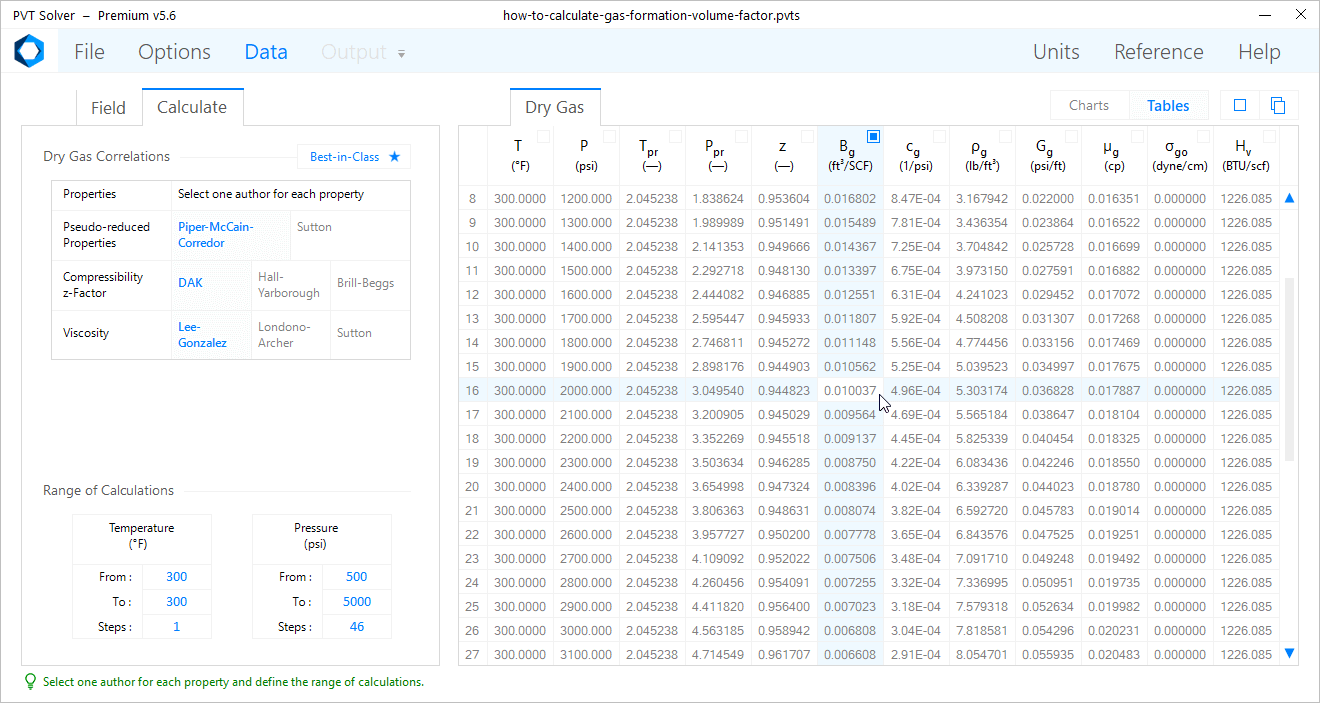
9
On the right-hand side, obtain a value of the gas formation volume factor at any reservoir conditions.
Note: In this example, the gas formation volume factor is estimated at 0.010037 ft3/scf for a dry gas reservoir with a specific gravity of 0.7 at 300°F and 2000 psi.
Note: In this example, the equation used to calculate the gas formation volume factor applies the Dranchuk-Abou-Kassem (DAK) (1975) correlation for the gas compressibility z-factor along with the Piper, McCain, and Corredor (1999) correlation for the gas pseudo-critical properties.
With our Premium Software, you can predict the behavior of 30 reservoir fluid properties, use 58 PVT correlations for dry gas, black oil, and formation water, match your lab data with 5 most popular models, export 500 lines of calculations, and more.